flowmetrics
A demo-quality tool for flow metrics and Monte Carlo forecasting, against GitHub (PRs and Issues) or Atlassian Jira issue data. Built on the kanban flow-metrics framework as laid out in Daniel Vacanti’s Actionable Agile Metrics and When Will It Be Done? — assumptions are surfaced on the page itself, not buried in docs.
Live site: https://dvhthomas.github.io/flowmetrics/
What it looks like
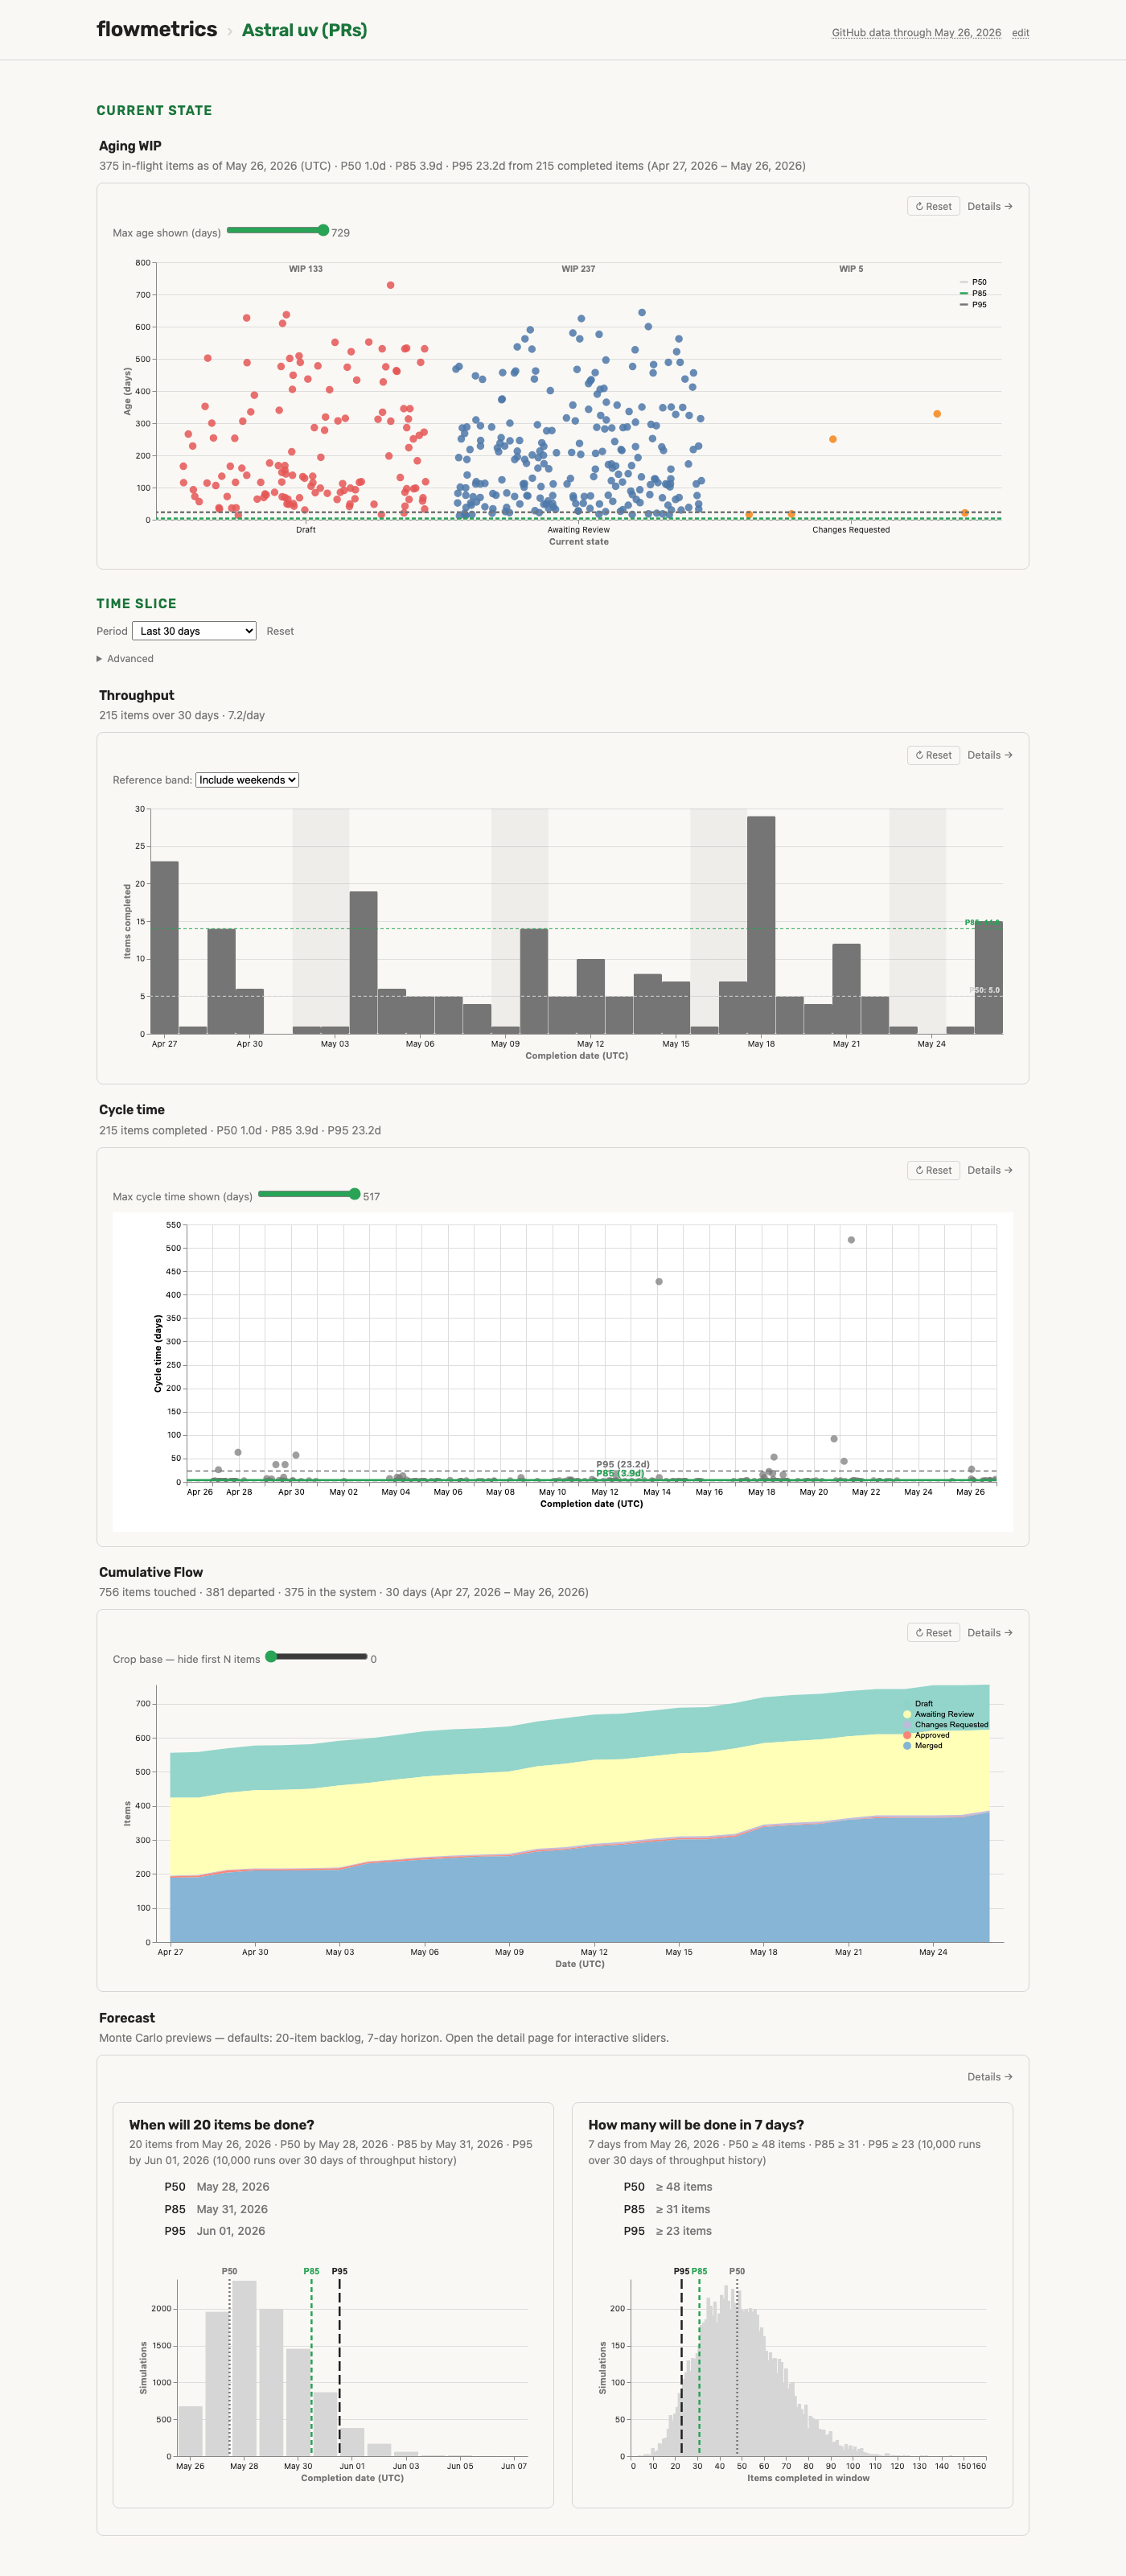
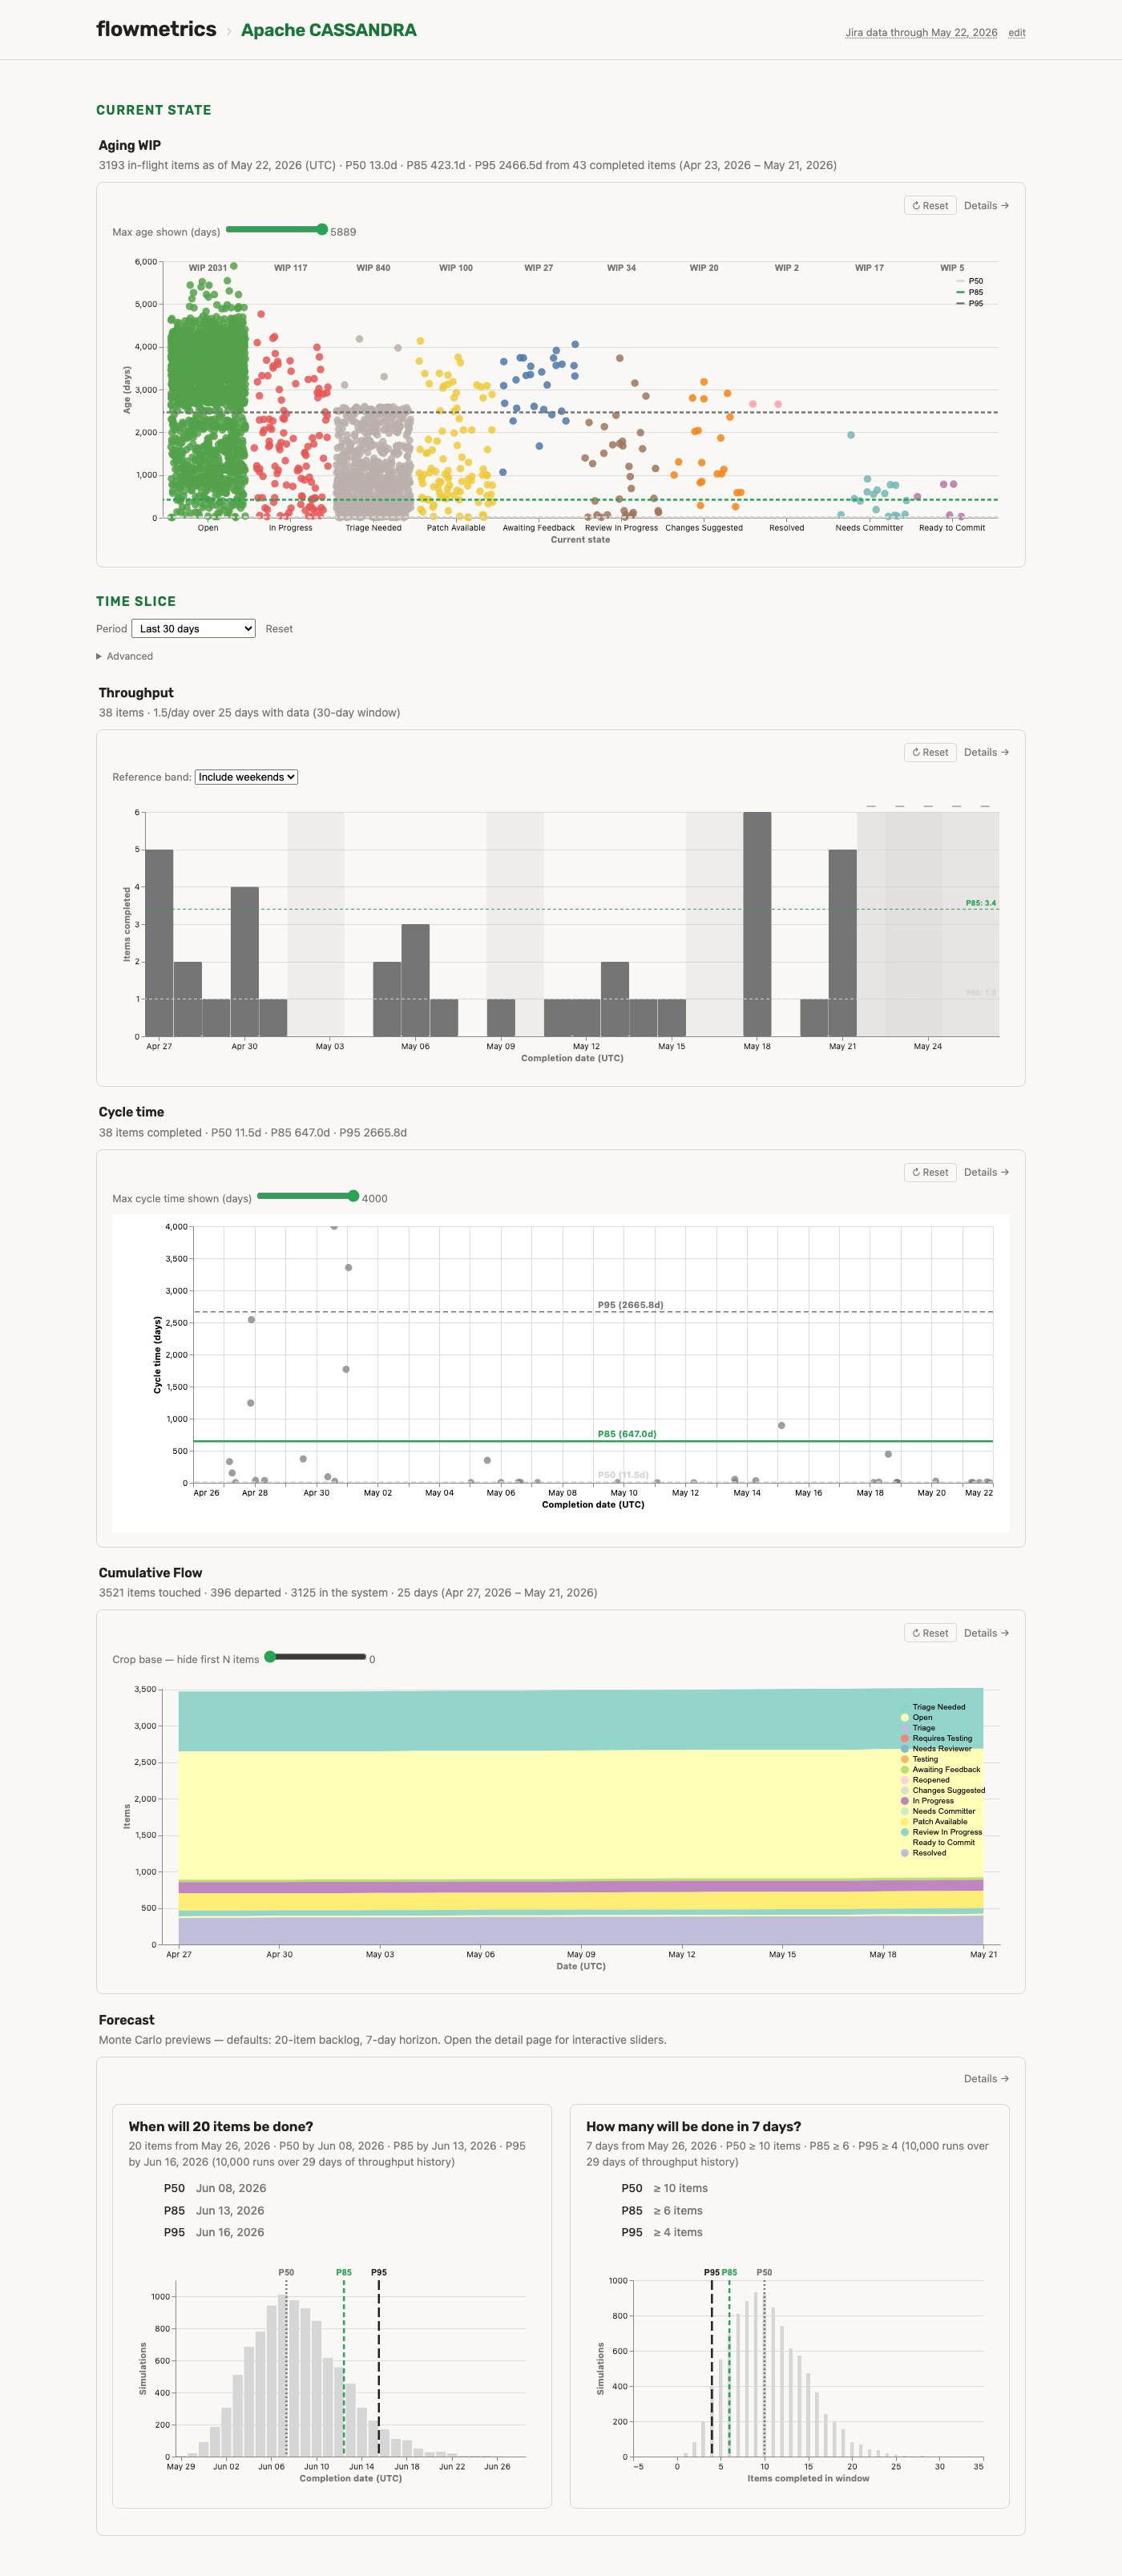
The dashboard splits into a Current state snapshot (Aging WIP, pinned to the latest data) and a Time slice (Throughput, Cycle Time, CFD, Forecast — all driven by the Period picker). Same shape for every workflow:
GitHub — astral-sh/uv (PR review cycle)
Jira — Apache CASSANDRA (richer multi-stage workflow)
More screenshots → — per-metric detail pages, the contract builder, and the data-source page.
Example workflow YAMLs → — copy-paste starters for GitHub PR cycles, label-driven workflows, and Atlassian Jira projects.
Install
# 1. Install uv (Python toolchain). macOS / Linux / Windows one-liners
#    at https://docs.astral.sh/uv/.
brew install uv                                  # macOS
# curl -LsSf https://astral.sh/uv/install.sh | sh   # Linux
# irm https://astral.sh/uv/install.ps1 | iex        # Windows PowerShell

# 2. Install flowmetrics as a global tool (isolated env, exposes `flow`).
uv tool install git+https://github.com/dvhthomas/flowmetrics

# 3. Smoke-test.
flow --help
Full walkthrough: Tutorial — zero to dashboard in five minutes.
Two ways to use it
Interactive dashboard — start the server, configure workflows in
the browser, browse charts. The wizard probes your GitHub repo or
Jira project, suggests stages, and writes a workflows.db — no
hand-edited YAML needed.
flow serve              # → http://127.0.0.1:8000 → "+ New workflow"
# macOS + Linux: `flow serve --bg` installs a persistent native
# service (launchd / systemd-user) so the dashboard survives
# logout and reboot.
Metric extraction for agents — graphics-free text + JSON output
for pipelines and headless analysis. Each command points at a
configured workflow (--workflow-name) or a YAML file
(--workflow-yaml).
$ flow metric cycle-time --workflow-name astral-uv \
    --start 2026-05-04 --stop 2026-05-10
astral-uv (astral-sh/uv) 2026-05-04 → 2026-05-10: 46 completed items;
P50=1.2d, P85=3.4d, P95=7.1d.

$ flow forecast date --workflow-name astral-uv --items 50 --format json \
    | jq '.summary.percentiles'
{"50": "2026-05-19", "70": "2026-05-21", "85": "2026-05-23", "95": "2026-05-26"}
What you get
- Cycle Time — per-item cycle times with empirical P50/P85/P95.
- Throughput — daily completion counts with an empirical P50/P85 reference band.
- Cumulative Flow Diagram — the six standard CFD properties laid out honestly: arrivals on top, departures on bottom, vertical distance = WIP, slope = arrival rate.
- Aging WIP — every in-flight item plotted by current workflow state × age (CD − SD + 1), with completed-item percentile lines as risk thresholds.
- Forecasts — Monte Carlo
flow forecast date(date for N items) andflow forecast throughput(items by target date) at 50/70/85/95% confidence.
Why this exists
Most flow-metrics products implement the kanban-flow toolkit partially or with subtle distortions — a CFD that smooths over the vertical-distance-equals-WIP property, an Aging chart with percentile lines drawn from arbitrary windows. This project implements the math honestly, surfaces the assumptions on the rendered page itself rather than hiding them in docs, and links out to the canonical references where a number could be misread. It’s a learning artifact, not a product.
Documentation
Organised by Diátaxis: a tutorial to learn from, how-to guides for specific tasks, reference for canonical facts, plus background explainers. Doc index →
Tutorial — learn
- Tutorial — zero to dashboard in five minutes. Install, write a YAML, materialize, serve.
How-to guides — solve a specific task
- How-to index — install on each OS, schedule fetches, run as a persistent web server, back up + restore, Docker, metric extraction for agents, troubleshooting.
Reference — canonical facts
- CLI + YAML + file layout + output envelopes — every command, every flag, every file, every schema.
- Glossary — terms and definitions; the terms we deliberately avoid (Scrum-contaminated “backlog” and “velocity”).
Explanation — understand the design
- Monte Carlo forecasting — the
math behind
flow forecast dateandflow forecast throughput. - Decisions — architectural trade-offs and known constraints (GitHub API caps, cache strategy, WIP-tracking source scope).
- GitHub label-driven CFD and Aging
— design rationale for the
wip_labelsmode. - Screenshots — every page, both source types (GitHub PRs + Atlassian Jira), captured against live data.